Interpreting water storage trends from GRACE
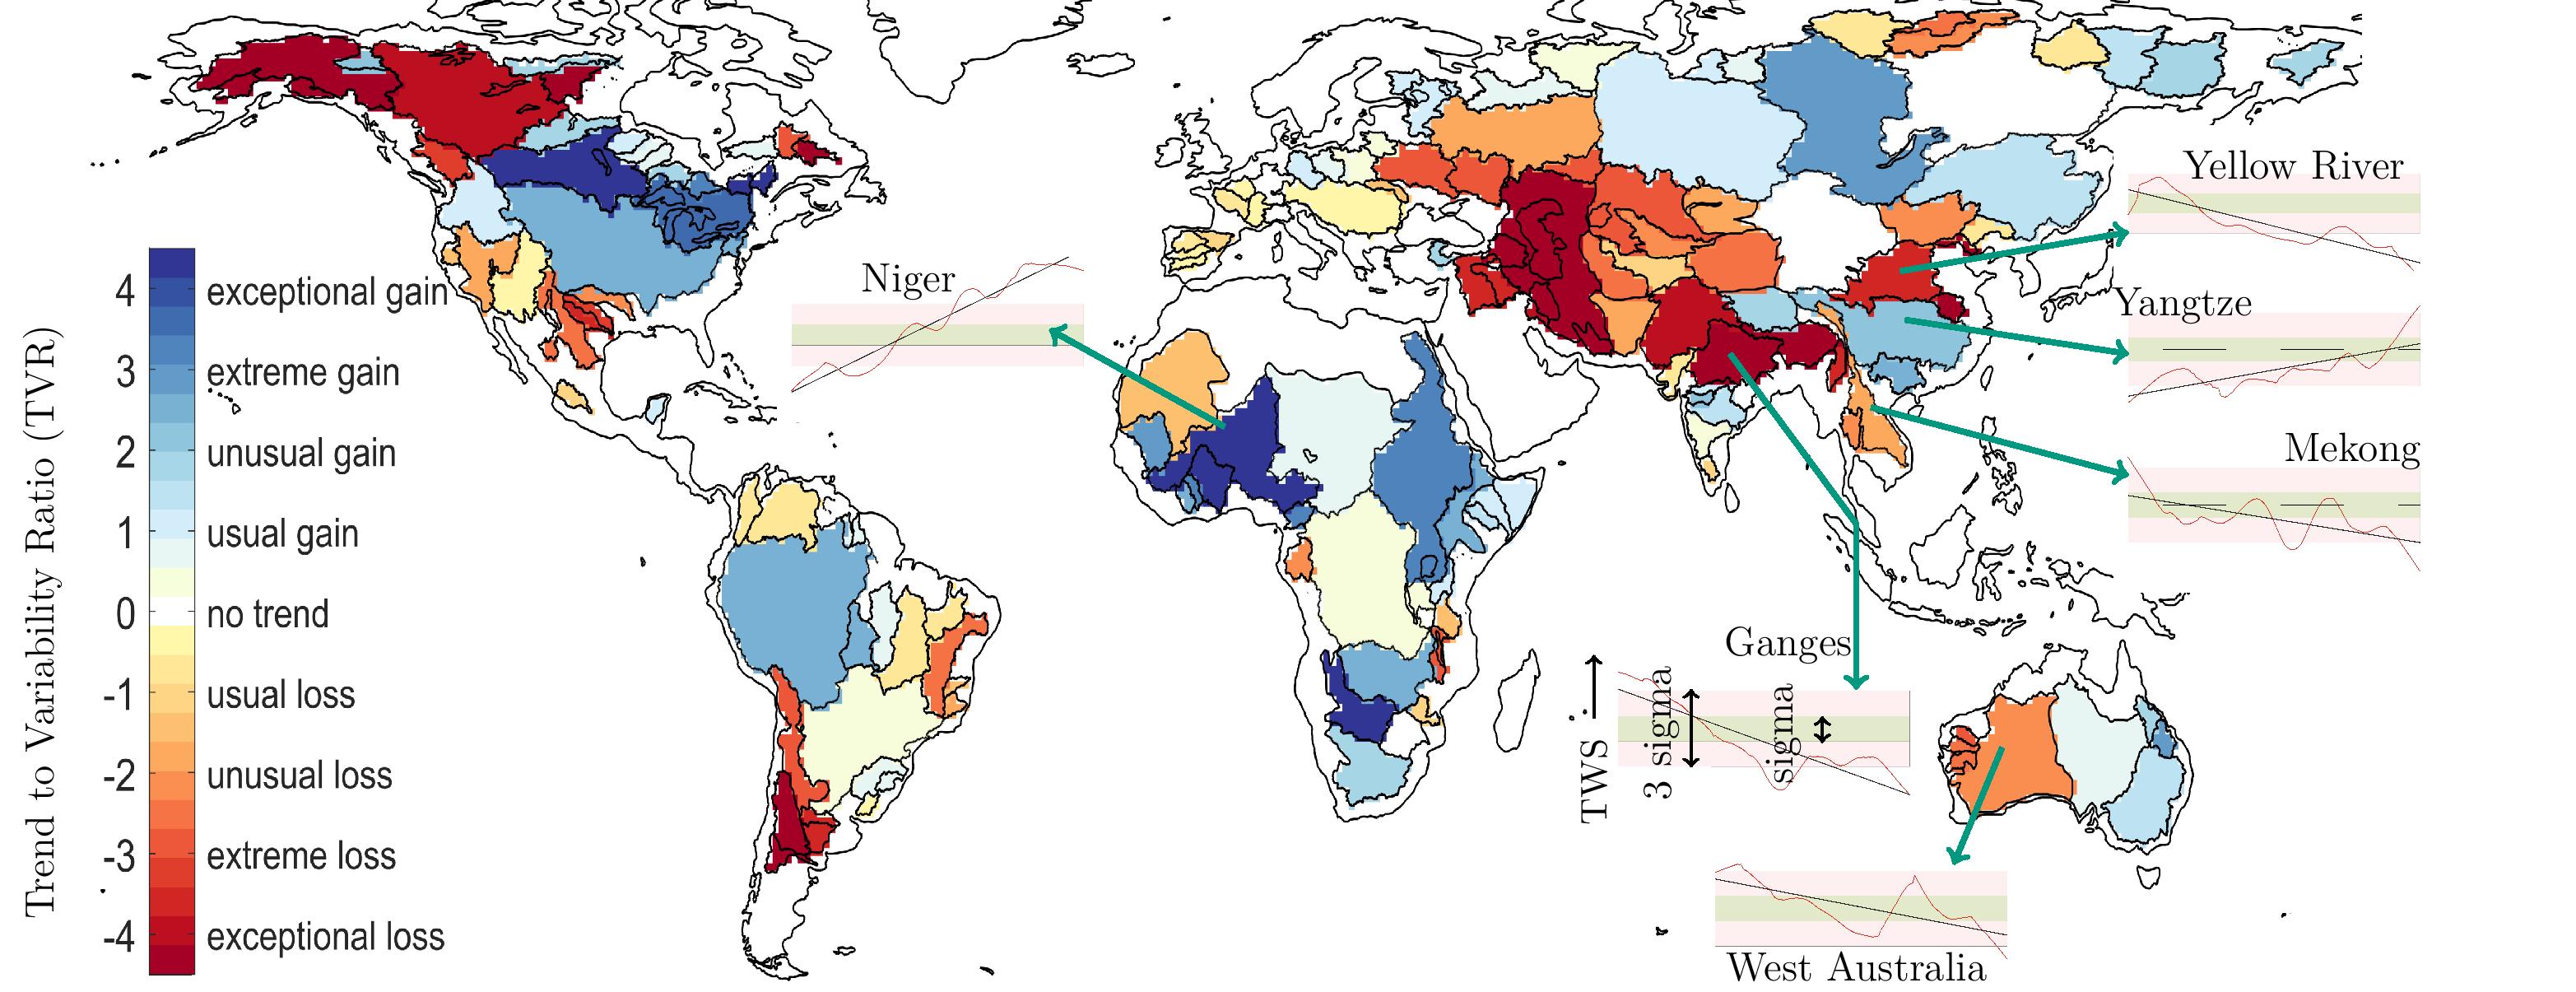
GRACE data has been abundantly used in research studies that want to capture a long-term water mass change, such as diminishing water bodies, droughts, and so on. The popular approach has been to first decompose the GRACE time series into seasonal signals and a linear trend, then by assuming that the magnitude of trend is directly proportional to the severity of water mass change, where regions with strong trends are investigated for the driving process (human-driven or climate change driven or extreme events). Since GRACE data covers less than two decades, any long term (multidecadal) natural hydrological variability would appear in the linear trend estimates. Furthermore, different regions have different natural variability cycles, for example, the ups and downs in water availability over a year in part of the Middle East (that is usually very arid) can be much smaller than in the Europe. This makes a comparison of trends between two regions very difficult. Hence, understanding the severity of linear trend obtained from a short time series, when the driving processes has a cyclic behaviour that lasts more than a decade can be challenging. This problem has been addressed in a recently published article (https://doi.org/10.1088/1748-9326/abd4a9), where the authors propose a new metric to interpret the strength of trends with respect to long term natural spatiotemporal variability: Trend to variability ratio (TVR). It normalizes the total change in water mass in a region with the standard deviation of multidecadal natural hydrological variability obtained from simulations. TVR is an excellent tool for analysing the severity of short time series from other observational datasets.


